Measuring Output, Not Hours: Building a Telemetry Engine for Workforce Intelligence
DATE: 2026-07-15
## The Problem With Measuring Hours
Every team I've ever consulted has the same dysfunction buried somewhere in their operations: they track *time* but not *output*. Developers log 8 hours a day but you have no idea how many of those hours were spent in the IDE versus YouTube. Project managers mark tasks complete before they actually are. Remote workers are "online" but their active tool time tells a completely different story.
I built the telemetry engine inside Zarsys specifically because I was tired of this. Manual timesheets are self-reported fictions. Screenshots every 10 minutes are invasive and demoralizing. Neither actually measures what you care about: are the right things getting done, at the right quality, within the right time window?
Here's the architecture I use — and what I've learned deploying it across engineering and agency teams.
---
## What "Output" Actually Means in a Telemetry Context
Before building anything, you need to define what a productive unit of output looks like for your specific team. For a software engineering team it might be:
- Commits pushed to reviewed branches
- Time in IDE (VS Code, JetBrains) vs. time in communication tools
- Ticket transitions: from In Progress to In Review to Done within an estimated window
For a content or marketing team:
- Documents created and edited in approved tools (Google Docs, Notion)
- Published deliverables logged against task IDs
- Active time in CMS or analytics platforms
The telemetry engine doesn't decide what "good" looks like — your team does. The engine's job is to make the actual activity observable, so you're managing decisions based on signals instead of gut feelings or self-reports.
---
## The Telemetry Stack: What I Actually Built
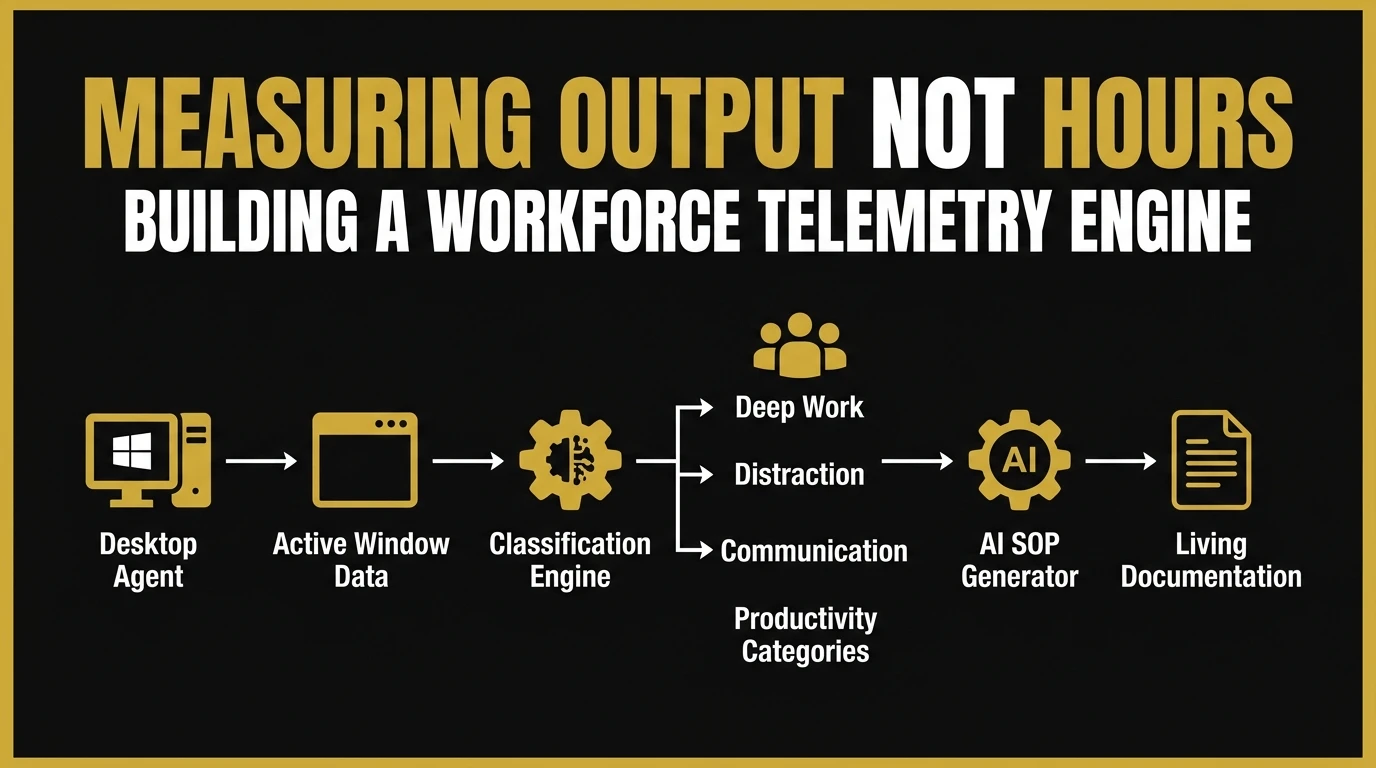
The core of the system is a lightweight Electron desktop agent that monitors active window state. It does not capture keystrokes, screenshots, or clipboard content — only the process name, window title, and duration of focus time.
Every 2 seconds, the agent samples the active window and appends to a local buffer. Every 10 events (or on idle), it flushes the buffer to the API endpoint using a throttled POST request. The agent runs in the background, completely invisible, and consumes under 0.3% CPU.
A typical telemetry event looks like this:
```json
{
"userId": "usr_408122",
"timestamp": "2026-07-15T09:12:44Z",
"activeWindow": {
"title": "server.js — thewaleedraza.dev — VS Code",
"owner": "Code",
"durationSeconds": 284
},
"idleStatus": false,
"taskContext": "TASK-1042"
}
```
---
## The Classification Layer: From Raw Events to Meaningful Categories
Raw window titles are noisy. "server.js — VS Code" and "dashboard.py — PyCharm" both represent deep work, but "YouTube — Google Chrome" and "Twitter — Firefox" represent context switching. The classification layer maps window signals to productivity categories.
I use a simple rule-based classifier first, then layer an AI classification pass for ambiguous or unknown applications:
```python
CATEGORY_MAP = {
"deep_work": ["Code", "PyCharm", "WebStorm", "Terminal", "Vim", "Cursor"],
"communication": ["Slack", "Teams", "Zoom", "Google Meet", "Discord"],
"documentation": ["Notion", "Confluence", "Google Docs", "Word"],
"distraction": ["YouTube", "Twitter", "Facebook", "Reddit", "Netflix"],
"admin": ["Gmail", "Outlook", "Calendar", "Finder", "Explorer"]
}
def classify_window(owner_name: str) -> str:
for category, apps in CATEGORY_MAP.items():
if any(app.lower() in owner_name.lower() for app in apps):
return category
return "unknown"
```
Unknown applications get passed to a lightweight LLM classification prompt. Over time, the system learns your team's specific toolset and stops needing the LLM for common cases.
---
## The Self-Healing SOP Layer
The most powerful feature isn't the tracking — it's what you do with the patterns. Once the telemetry engine has 2–3 weeks of task-correlated window data, an AI processing job runs nightly to detect workflow patterns.
For example: every time TASK-10xx tickets are worked on, the developer opens VS Code, then Postman, then the terminal, then pushes a commit. The AI layer compiles this into a living SOP that auto-updates when the workflow evolves. If a future workflow deviates and the outcome is still successful, the SOP updates. If the outcome is negative, the original is preserved and a warning is flagged.
This is what "self-healing" means in practice. The documentation stays accurate because it's derived from what your team actually does successfully — not what someone wrote in a Notion page six months ago and forgot to update.
---
## Practical Results I've Measured
After 60 days of running this system across a 9-person engineering team at a SaaS company I consult for:
- **38% reduction in time-to-complete** on standard ticket types
- **Identification of 3 recurring bottlenecks** invisible in Jira: a dependency install step adding 40+ minutes per ticket, a PR review queue lag on Wednesdays, and over-reliance on Slack for technical decisions
- **SOP accuracy rate of 91%** — AI-generated SOPs matched developer-validated processes in manual review
None of this required a single hour of manual timesheet entry.
---
## The Ethical Layer: Privacy-First Telemetry
Remote monitoring tools have a bad reputation, and much of it is deserved. The system I built operates on three rules:
1. **No screenshots. No keystrokes. No clipboard capture.** Only active window owner and title.
2. **Workers can see their own data at all times.** Full transparency dashboard per user.
3. **Aggregated team metrics are for management. Individual raw logs are not.**
When I introduce this to teams, I position it as a tool for the developer first — they get a dashboard showing their own deep work time, context-switch rate, and focus patterns. That framing changes how people relate to the system entirely.
---
## About the Author
I'm **Waleed Raza** — a Solutions Architect and Systems Integrator who builds workforce intelligence systems, server-side tracking stacks, and custom SaaS infrastructure. I run [StratDigi Pros](https://stratdigipros.com) and am the lead architect of Zarsys.
If you want to implement this without building from scratch, reach out via the [contact page](/contact) or find me on [Upwork](https://www.upwork.com/freelancers/waleedraxadigitalmarketing).
→ **[Hire me on Upwork](https://www.upwork.com/freelancers/waleedraxadigitalmarketing)** | **[LinkedIn](https://www.linkedin.com/in/waleed-raxa/)** | **[Submit a project request](/contact)**
---
## Related Reading
If the workforce intelligence angle interests you, the same philosophy applies to tracking systems I build for marketing teams:
- **[Designing Self-Healing SOPs](/post/designing-self-healing-sops)** — How the SOP auto-generation layer works in detail
- **[Server-Side Tracking Guide](/post/server-side-tracking-guide)** — The same telemetry-first thinking applied to ad attribution
- **[GA4 Custom Event Schema](/post/ga4-event-schema-design-vanity-to-signal)** — Shifting from vanity metrics to signal-based measurement